
Complex Biosystems Inc.

Protein kinetics analyzer
The protein kinetic analyzer software (pkAnalyzer), interprets data collected in isolated cells to estimate the kinetics of membrane proteins. The analyzer includes all functionality necessary to process voltage clamp data collected in the cell attached configuration, but data collected through other mechanisms could also be interpreted. pkanalyzer can directly import data produced by axoclamp instruments. At the core of the analysis is a theory to invert the ordinary differential (ODE) underlying a kinetic model. This one is powerful in the sense that it enables to unambiguously estimate protein kinetic and in doing so avoid all limitations inherent to nonlinear least square fitting. The process in question is patented. Like any theory, it has conditins of application, but the software includes functions to verify whether the application conditions are met.
Steps of an analysis
- Pre-process the acquired data to remove noise
- Estimate the parameters the capacitive transient
- Perform an ensemble average of the acquired, weighted with cell capacitance
- Remove the capacitive transient from the experimentally acquired currents
- Assess the suitability of the data set for kinetic analysis purposes
- Determine whether the conditions of application of a theory are met
- Estimate the voltage dependence of the kinetic model static component
- Estimate the voltage dependence of the kinetic model dynamic component
- Process data containing changes in both static and dynamic components
Most of the time data are contimanied with noise, by 60 Hz, and 120 Hz due to the proximity of a power sources and the rectification of AC current to generate DC. There are also other sources of contamination depending on the recording conditions. pkAnalyzer eliminate these artefacts with adaptive filetring.
Signals recorded in isolated cells are of small amplitude and therefore are particularly subject to noise contamination. One of the best way to eliminate noise in these conditions is to perform an ensemble average with data collected in multiple cells. However cells of a species, even if they come from the same tissue, largely vary in size. Assuming protein expression (or density) constant in a tissue (or tissue region) the current magnitude is expected to be proportional with the cell surface. Experiments shows cell size to vary up to a factor 4. Thus data averaging across cells need to be weighted for cell surface. One of the best way to estimate the surface available for ions exchange is to measure the cell capacitive transient. Carefully tuned voltage clamp stimuli can generate capacitive transient in absence of any ionic current . If this data is available pkAnalyzer includes functions to un-ambiguoulsy evaluate capacitance size.
Data collected in several cells are ensemble averaged. The average is weighted by the cell surface available for exchange of ions, which is given by the cell capacitance. This parameter is estimated analyzing the time course of the capacitive transient and considering the specifications of the amplifier. Given a set of traces on different cells, and capacitive transients on eah, pkAnalyzer can automatically perform an ensemble average weighted for cell surface.
When the capacitive transient is not available, pkAnalyzer can compare currents collected on different cells but with exactly the same stimulation. This is a viable aternative, but the quality of the analysis is better when the capacitive transient is available.
This is necessary when analyzing protein exhibiting fast kinetics, like the sodium or the transient outward potassium currents. These currents are so fast that they significantly change during the capacitive transient generated by a cell subjected to voltage clamp stimulation. As a rul we always remove the capacitive transient from the traces.
It is not trivial to remove a capacitive transient generated in a voltage clamp stimulation because the transient is so fast that the feedback circuit of the amplifier cannot clamp the membrane voltage over the entire duration of the transient. Precise removal of the current requires to take into consideration the nonlinear respsone of the cell-amplifier configuration, which can only be done with some knowledge of the amplifier transfer fucntion.
pkAnalyzer takes into consideration all these factors when removing a capacitive transient.
A data set, even if large, may not be of adequate for kinetic analysis purposes. A set of current traces may for example not be independent from one another when considering these been generated by a specific electrochemical process. Independence or near independence of a set of current traces is crucial for the quality of an analysis. pkAnalyzer includes functions to asses the independence of the data prior to any analysis.
pkAnalyzer estimate the components (parameters & functions of voltage) of ordinary differential equations (ODEs) governing a kinetic model of a membrane protein (channel or receptor). It is based on a novel theory that inverts the ODE. This is an important point because the procedure allevitaes all limitations inherent to nonlinear least square fitting, which was so far the basis of all methods to estimate ODE components, and has severe limitations. At this stage we have a full implementation of the theory for the Hodgkin-Huxley formalism, but support for other formalisms are coming soon. The theory in question been applied to experimental data and been validated. Fortunately, the kinetics of a large number of membrane proteins can be modeled with the Hodgkin-Huxley formalism.
The theory in question includes several theorems, and is applicaable under certain conditions. These conditions involve generating the data with stimulation protocols meeting specific criteria. Fortunately, it is possible to conduct an analysis that determine whether the conditions of application have been respected. The method is documented in the pkAnalyzer user manual
Any formalism includes a static and a dynamic component. The static component, or the steady state, refers to the state a protein reaches when the environmental factors affecting its configuration do not change. For a voltage gated membrane channel it is the membrane voltage. For example, when the membrane voltage is clamped at a specific value, open and closed channels reach a given distribution. In the Hodgkin-Huxley formalism it is quantified by steady state curves for each molecular gate. In the Markov formalism by the eigenvectors of the transition matrix.
The dynamic component expresses the time a protein population takes to change from one distribution to another. For a voltage gated channel, when the voltage of a voltage clamp stimulation protocol is stepped from one value to another, the open/closed channels transit from one distribution to another, and this process takes time. This is expresses by time constant for each protein configuration, or molecular component. In the Hodgkin-Huxley formalism this is quantified by the the time constant of each molecular gate, for a Markov formalism by the eigenvalues of the transition matrix
In our approach to kinetic analysis we estimate the static component first. This analysis is based on data quantifying the state reached by proteins when factors influencing its configuration remain constant for a long interval of time, long enough to reach steady state. For the Hodgkin-Huxley or Markov formalism this means data collected when the holding potential of a voltage clamp stimulation is changed.
pkanalyzer enable to unambiguously, without fitting, estimate the voltage dependence of the static component (or steady states) of an Hodgkin-Huxley formalism. It does so in the voltage range where the data been collected.
The dynamic component is estimated with data showing the time taken by a population of proteins to transit from one distribution to another. For voltage gated channels it is estimated with data collected when the test voltage of a voltage clamp stimulation protocol is varied.
Compared to the static component, the characterization of the dyanmic component of a formalism requires a more extensive data set. Contrary to current belief, the nature of this data set is not trivial.
Our theory can unambiguously, without fitting, estimate the time constants of the dynamic component of an Hodkin-Huxley formalism. In doing so we bound the kinetic model components extracted from the data set. Therefore if the data do not fully constrain the kinetic model, the bounds are wide. Several kinetic model components (functions of voltage, e.g., time constant) can be defined inside these. This way several different kinetic models can reproduce the experimental data set, and the theory allows to extact them.
In other words our theory can determine a-priori whether the data set fully constrain the model, and if it does not it can extract several models reproducing this data set. When the data set does not fully constrain the kinetic model we say it is incomplete with respect to the kinetic model. Facing an incomplete data set an experimentalist may elect to supplement it with a complementary data set, and our theory will asist in determining the nature of the data needed to complement the existing data set
Alternatively the experimentalist can used models extracted from his/her data set to determine what are really the consequences of having partially characterized the kinetic model. In any even an experimentalist is well aware on the nature of his/her data set.
pkanalyzer fully implement these functions for the Hodgkin-Huxley formalism.
Considering experimental constraints, it is often not possible to generate data characterizing just the static component over the entire voltage range one wishes to characterize the a kinetic of a protein. An example for voltage gated channels is that it is not possible to clamp an excitable cell at a high voltage for a long interval of time. Depending on experimental conditions a large potassium current can be generated and this one may change the intracellular ionic ionic composition of a cell to the extent where it kills it,
In this event we have to work with data generated by cell stimulation protocols that alter both the static and dynamic components. Such data sets should be interpreted differently for kinetic analysis purposes. We have suggested and analyze protocols of this type for the Hodgkin-Huxley formalism (see advantage of pkanalyzer below). pkanalyzer supports such analysis.
Advantages of our analyzer
|
The main advantage of the analytical method included in pkanalyzer is to alleviate all limitations inherent to nonlinear least square fitting. An element of this advantage is illustrated in Figures 1-3. The example is taken from: "Extending the conditions of application of an inversion of the Hodgkin–Huxley gating Model", by Raba A., Cordeiro J.M., Antzelevitch A. and Beaumont J. Bulleting of Mathematical Biology, 2013, Volume 75, Issue 5, pp 752-773.
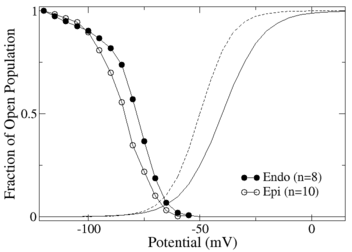
Figure 1 shows the voltage dependence of the activation and inactivation components of a sodium current model estimated from data generated in endocardial and epicardial cells of a dog heart. In this data set only the holding potential of a voltage clamp stimulation protocol was varied, and the variation was in the voltage range shown by the symbols. Using our method, we estimated the steady states for each cell type. The results of the estimation are the symbols on the curve.
Taken alone this data set is incomplete because it does not provide kinetic data on the static component of the Hodgkin-Huxley formalism where activation changes with voltage. Sine a characterization of that component is unavailable, we forged one with a synthetic model. The corresponding curves are shown on the right.
|
|
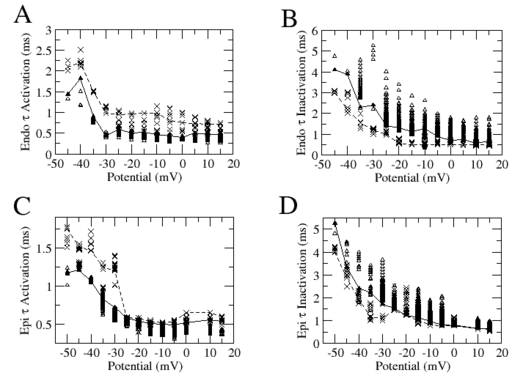
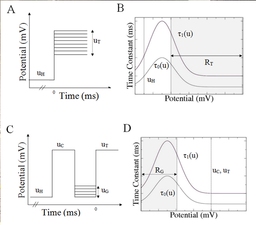
Then we supplemented this data set with kinetic data gathered varying the test potential of a voltage clamp stimulation protocol in the same cell types. The test potential was varied in the potential range where activation changes significantly with voltage. We used these 2 data sets to estimate the dynamic component of the Hodgkin-Huxley formalism in occurrence the voltage dependence of the activation and inactivation time constants.
Application of our method shows that these two data sets, although extensive, do not fully constrain the kinetic model. Functions bounding unknown model component are far apart from one another. We exploited this to extract different time constants, or different models, that can reproduce the data within experimental error. This is illustrated in Figure 2 where extracted two different time constants (here function of voltage) for each of the activation and inactivation components and for each cell type. Each can reproduce the experimental data set.
|
|
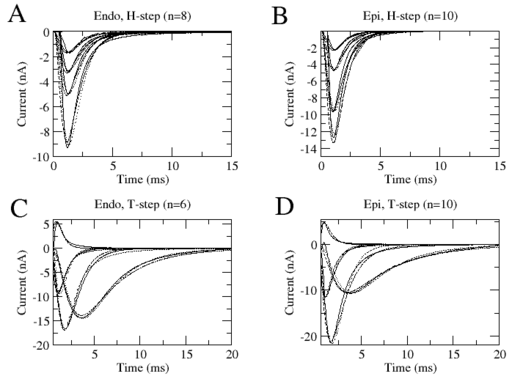
This is a strong statement because as of now, the kinetic of voltage gated channels is estimated with such data. Clearly Figure 3 shows that the different kinetic models estimated in Figure 2, can reproduce equally accurately the same data set. Specifically in this Figure we show currents produced by two stimulations protocols (solid lines), one where the holding and one where the test potential were varied. We superimposed to these curves the predictions made by two different models (dahsed curves) shown in Figure 7. Clearly these two models, although different, reproduce equally well the data set. Still they are significanlty different as judged by the time constants in Figure 2. Furtheremore the activation steady states were arbitrarily picked. Thus this exercise could be repeated with different steady states. Consequently the differences in the model that can reproduce these two data sets can be quite extensive.
The reader should note that we picked only 4 traces in each protocol for the sake of clarity. The two models reproduce equally well all tracse of each protocol.
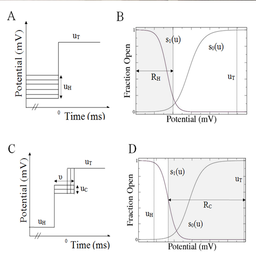
The situation just depicted has considerable implications for predictions generated by kinetic models. Fortunately there exist a solution to this problem. In the above refered paper and patent, we documented stimulation protocols that can generate a complete data set. A set of 4 stimulation protocols as opposed to the 2 conventional ones can produce a complete data set. They are illustrated in Figure 4. They were applied on synthetic data in the paper we refered to here, but another paper will be published with application to biologic data. pkAnalyzer includes necessary functions to complete a full estimation based on this data.