
Complex Biosystems Inc.

xScheme Viewer
| Graphic objects | Description |
|---|---|
| Symbols | Circles, squares, diamonds, cross, ...etc. in 2D and 3D |
| Curves | Single or array of curves displayed with different patterns in 2D or 3D |
| Histograms | One axis histogram |
| Vector fields | Layout in 2D, 3D, or on surfaces |
| Stream lines | Patterns as used in fluid dynamics. Support 2D, 3D or on surfaces |
| Images | Displayed as tiles, stack of images, or stack of images on planes perpendicular to arbitrary axes. Multiple stacks can be displayed at the same time |
| Surface models | Arrays of triangles, quadrilaterals, or polygons, including material properties, and texture, displayed in a scene where lighting is controled by the user |
| Meshes | 2D: triangular and quadrilaterals. 3D: tetrahedral and hexahedral. Surface: triangular or quadrilateral |
| Volume rendering | Light reflected/transmitted by volume data (like a gas) to which material properties been assigned. Algorithms are based on overlaid textures or ray tracing methods. Data can be displayed on planes positioned along excursion axes |
| Field data | Scalar: color coded field on a surface model. Vector: vector field on a surface model. Both can be combined |
|
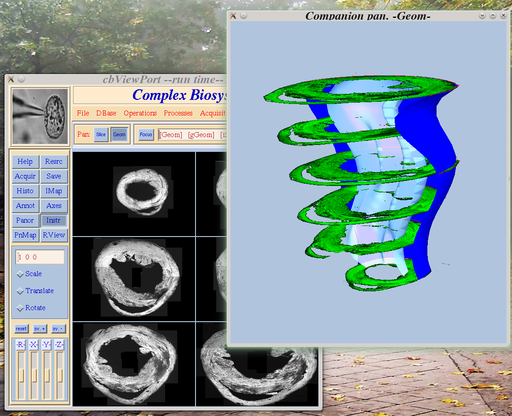
The Figure on the right is a screenshot of an application designed with our viewer. The application is used in heart model reconstruction. The left winow shows the basic layout of the viewer with control buttons. The two graphic windows are two panoramas included in this particular application. The one in the background display a sequence of images collected with an electro scanning microscope. The panorama on the right shows the same slices stacked at spatial locations where they were collected.
Operations like edge dected are performed on the slices and they results are mapped on the stacke. This data is subsequently used to fit parametric surfaces (shown in dark and light blue) to the contour data. All the underlying operations are performed interactively. The resulting surfaces are used to mesh the heart and model electric conduction.
| Processes | Description | |
|---|---|---|
| image, stack of images, or volume data | ||
| Contrast enhancement | Application of gradient operator to enhance contrast | |
| Segmentation | Class data according to their texture properties | |
| Edge detection | Automatic: contour extraction with the sobel algorithm. Assisted: Contour extraction based on active controus algorithms. Applies only to images and stack of images. | |
| Convolution | Convolve an image with a pre-determined pattern. Applies only to images and stack of images. | |
| Filtering | Fourier transform based filtering. Applies only to images and stack of images. | |
| Gradient | Extract 2D intensity gradient vectors | |
| Mask | Apply local operations based on weights in a mask | |
| Surface extraction | Extract triangulated surface crossing a pre-determined gray level. Based on a modified marching cube algorithm. Applies only to volume data. | |
| Surface models | ||
| Contour | Extract contours based on elements connectivity | |
| Length | Calculate contour length by summing segments length | |
| Area | Calculate area by summing elementary polygonal areas | |
| Vector fields in 2D, 3D, or on surfaces. | ||
| Divergence | Calculate the divergence of a vector field and color code the result | |
| Rotational | Calculate the rotational of a vector field and color code the result | |
| Trajectories | Track the trajectories of a set of initial points displaced along a path tangent to the vector field | |
| Mesh, 2D, 3D, or surfaces | ||
| Structure | Display mesh edges in a domain with elements surface redenred in a manner to visualize the mesh structure | |
| Jacobian | Calculate the Jacobian of each mesh element and color code the result | |
| Area/Volume | Calculate elementary area/volume of mesh elements and color code the information | |
| Orthogonality | For quadrilateral and hexahedral meshes metric on mesh orthogonality and color code the infrmation | |
| Property | Detect mesh elements not meeting some cirteria, e.g. Jacobian, rate of spatial change in area/volume. | |
|
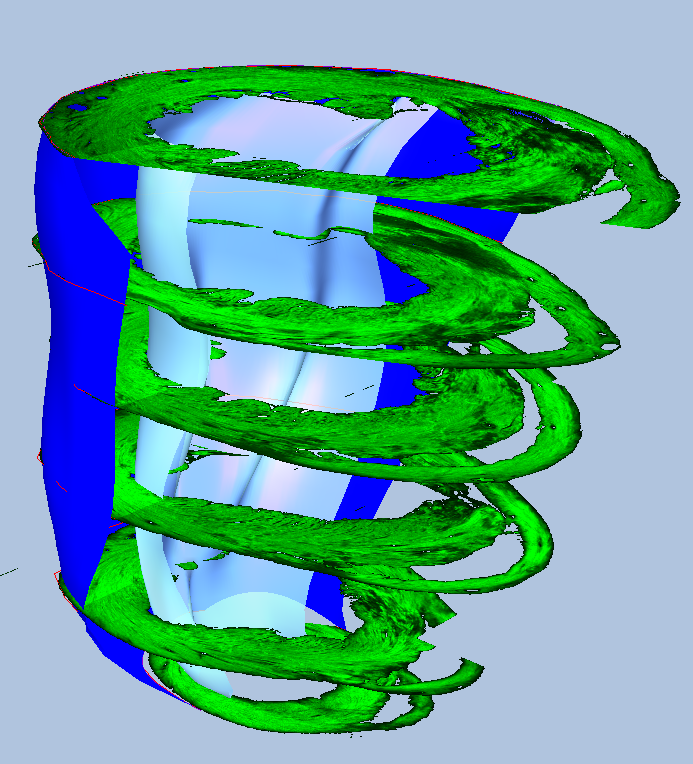
The above panorama is a close up on the image stack and surfaces fitted to the border of the slices. It is a step in the reconstruction of a heart model. In this case were are interested to reconstruct a detailed geometry, and to see simulatneously cardiac fiber orientation and to do so in convoluted regions of the heart geometry.
Here a geometric reconstruction based on the frontiers delineated from the slices, and also based on CT slices (data not shown) allow the operator to inspect this geometry. The epicradium (dark blue) and left ventricle (light blue) are displayed as surface models. The left ventricle is semi-transparent in order to see the fiber structure.
cross sections of the heart stained for myofibrils and imaged at different height with a laser scanning confocal microscope are show in green. The slices are displayed as textures in 3D. The image intensity moulates the texture. The operator can follow how fiber orientation changes across the heart and can do so ine relation to specific features of the geometry.
Since our viewer support all viewing modalities required by this task, an application like this one can be readily created with the builder